AI Workforce Business Case Construction: Cost Model, Baseline, ROI Evidence
Build an investment case for AI workforce adoption. Covers cost model components, baseline measurement method, ROI calculation, and evidence collection plan with a...
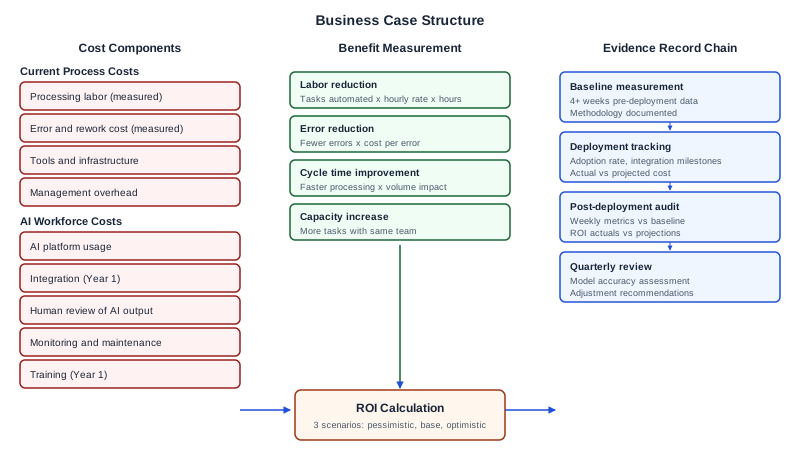
Step 1: Define the scope and measurement boundary
Owner: Business analyst, with process owner input.
Before building the cost model, define exactly what you are measuring and what you are not. An AI workforce business case that tries to capture every possible benefit across the organization will be unfocused and undefendable. Start with a single process or team.
Define the following:
- Target process: What specific work does the AI workforce replace, augment, or accelerate?
- Team scope: Which team or teams perform this work today?
- Task boundary: Which tasks within the process are candidates for AI, and which require human judgment that the AI will not replace?
- Measurement period: Over what period will you measure baseline and post-deployment performance?
- Exclusions: What related work is outside the scope of this business case?
Output: Scope definition document with process name, team, task list with AI candidacy assessment, measurement period, and explicit exclusions.
Decision gate: Process owner and executive sponsor agree the scope is well-defined and measurable before proceeding.
Step 2: Measure the baseline
Owner: Process owner, with business analyst support.
The baseline is the current cost and performance of the target process without AI. A credible business case requires measured baseline data, not estimates or averages. If you do not have baseline data, collect it for at least 4 weeks before building the business case.
Baseline cost components
| Component | What to measure | Measurement method |
|---|---|---|
| Labor cost | Hours per week spent on target tasks, fully loaded hourly rate | Time tracking or structured observation for 4+ weeks |
| Error and rework cost | Errors per 100 tasks, average cost to correct each error | Error log review or sampling over measurement period |
| Tool and infrastructure cost | Software licenses, compute, storage used for the process | Invoice review for relevant tools |
| Management overhead | Supervisory time spent on the process (planning, review, escalation) | Manager time allocation estimate, validated by observation |
| Cycle time | Average time from task initiation to completion | Process tracking system or timestamp analysis |
| Quality score | Accuracy, completeness, or customer satisfaction measure relevant to the process | Quality audit or customer feedback data |
Baseline measurement guide
- Identify 4 or more consecutive weeks of representative operation (avoid holiday periods, seasonal peaks, or unusual events unless those are part of the normal cycle).
- Record task volume, completion time, error count, and quality score for each week.
- Calculate weekly averages and standard deviations.
- Document any anomalies and whether they were included or excluded.
- Have the process owner validate that the measurement period is representative.
Output: Baseline measurement report with weekly data, averages, variability ranges, and methodology description.
Failure mode: Using annual averages instead of measured data. Annual averages mask variability and make it impossible to detect whether post-deployment changes are real improvements or normal variation.
Step 3: Build the cost model
Owner: Business analyst, with finance partner validation.
The cost model has two sides: the cost of the current process (from the baseline) and the projected cost of the AI-augmented process.
Current process annual cost
Calculate from baseline data:
Annual labor cost = (hours/week on target tasks) x (fully loaded hourly rate) x 52
Annual error cost = (errors/week) x (cost per error) x 52
Annual tool cost = sum of relevant licenses and infrastructure
Annual management overhead = (supervisor hours/week) x (loaded rate) x 52
Total current annual cost = sum of above
AI workforce projected annual cost
| Component | What to include | How to estimate |
|---|---|---|
| AI platform subscription or usage | Per-task pricing, per-seat licensing, or consumption-based cost | Vendor pricing for projected task volume |
| Integration cost (Year 1) | Connecting AI to existing systems, data pipelines, workflow automation | Technology lead estimate based on integration complexity |
| Human review cost | Tasks that require human review of AI output before acceptance | Estimated review rate x hours per review x loaded hourly rate |
| Remaining manual labor | Tasks that remain fully manual after AI deployment | Hours/week x loaded rate x 52 |
| Training cost (Year 1) | Team training on AI tools and new workflows | Training program cost + productivity loss during learning |
| Monitoring and maintenance | Ongoing AI system monitoring, model updates, quality checks | Technology lead estimate, typically 10-20% of integration cost annually |
| Management overhead (adjusted) | Changed supervisory requirements for AI-augmented process | Estimated reduction or increase from baseline |
Cost model worksheet
| Line item | Current annual | AI-augmented annual | Difference |
|---|---|---|---|
| Labor | $ | $ | $ |
| Error and rework | $ | $ | $ |
| Tools and infrastructure | $ | $ | $ |
| AI platform cost | $0 | $ | $ |
| Integration (Year 1 amortized) | $0 | $ | $ |
| Training (Year 1) | $0 | $ | $ |
| Monitoring and maintenance | $0 | $ | $ |
| Management overhead | $ | $ | $ |
| Total | $ | $ | $ |
Output: Completed cost model worksheet with all input values and their sources documented.
Decision gate: Finance partner validates the cost model methodology, input sources, and calculations before ROI calculation.
Step 4: Calculate ROI with three scenarios
Owner: Business analyst.
Never present a single ROI number. Build three scenarios that reflect different assumptions about AI effectiveness and adoption.
Scenario definitions
| Parameter | Pessimistic | Base | Optimistic |
|---|---|---|---|
| AI task completion rate | 50% of candidate tasks | 70% of candidate tasks | 85% of candidate tasks |
| Error reduction | 20% reduction in errors | 40% reduction | 60% reduction |
| Adoption timeline | 6 months to full adoption | 4 months | 2 months |
| Integration cost overrun | +30% above estimate | On budget | -10% (efficiency) |
| Human review rate | 40% of AI outputs reviewed | 25% reviewed | 15% reviewed |
ROI calculation
For each scenario:
Annual net benefit = (current cost) - (AI-augmented cost)
Year 1 net benefit = annual net benefit x (months at full adoption / 12) - one-time costs
Year 2 net benefit = annual net benefit - ongoing costs
Year 3 net benefit = annual net benefit - ongoing costs
3-year cumulative benefit = Year 1 + Year 2 + Year 3
ROI = 3-year cumulative benefit / total investment x 100%
Break-even month = month where cumulative benefit exceeds cumulative cost
ROI summary table
| Metric | Pessimistic | Base | Optimistic |
|---|---|---|---|
| Annual net benefit | $ | $ | $ |
| Year 1 net benefit (incl. one-time) | $ | $ | $ |
| 3-year cumulative benefit | $ | $ | $ |
| Total investment | $ | $ | $ |
| 3-year ROI | % | % | % |
| Break-even month | Month | Month | Month |
Output: ROI calculation for three scenarios with break-even timeline.
Failure mode: Presenting only the optimistic scenario. Executive reviewers will discount the entire business case if it appears to show only the best-case outcome.
Step 5: Worked example: 20-person document processing team
A financial services company has a 20-person team that processes insurance claims documents. Each processor reviews incoming documents, extracts key fields, validates against policy records, and routes to the appropriate claims adjuster.
Baseline measurement (4-week average)
| Metric | Weekly average | Notes |
|---|---|---|
| Documents processed | 2,000 | ~100 per person per week |
| Processing time per document | 12 minutes | Including validation and routing |
| Error rate | 4.5% (90 errors per 2,000) | Field extraction and routing errors |
| Cost per error correction | $45 | Average rework time including supervisor review |
| Fully loaded hourly rate | $38 | Including benefits and overhead |
| Supervisor time on process | 15 hours/week | Review, escalation, training |
Current annual cost
| Component | Calculation | Annual cost |
|---|---|---|
| Processing labor | 20 people x 40 hrs x $38 x 52 | $1,580,800 |
| Error rework | 90 errors/week x $45 x 52 | $210,600 |
| Document management tools | Annual license | $48,000 |
| Supervisor overhead | 15 hrs x $52/hr x 52 | $40,560 |
| Total current | $1,879,960 |
AI-augmented projected cost (base scenario)
AI handles initial extraction and routing for 70% of documents. Remaining 30% and all complex cases remain manual. 25% of AI outputs receive human review.
| Component | Calculation | Annual cost |
|---|---|---|
| Remaining manual processing | 8 people x 40 hrs x $38 x 52 | $632,320 |
| AI platform usage | 1,400 docs/week x $0.50/doc x 52 | $36,400 |
| Human review of AI output | 350 docs/week x 4 min x $38/hr x 52 | $46,280 |
| Integration (Year 1, amortized over 3 years) | $120,000 / 3 | $40,000 |
| Training (Year 1) | $30,000 | |
| Monitoring and maintenance | $24,000 | |
| Error rework (reduced by 40%) | 54 errors/week x $45 x 52 | $126,360 |
| Supervisor overhead (reduced) | 8 hrs x $52/hr x 52 | $21,632 |
| Total AI-augmented (base) | $956,992 |
ROI summary
| Metric | Pessimistic | Base | Optimistic |
|---|---|---|---|
| Annual net benefit | $620,000 | $923,000 | $1,105,000 |
| Year 1 net benefit | $310,000 | $615,000 | $855,000 |
| 3-year cumulative | $1,550,000 | $2,576,000 | $3,215,000 |
| Break-even month | Month 8 | Month 5 | Month 3 |
These figures are illustrative and based on the assumptions above. Actual results depend on AI system performance, integration complexity, and adoption timeline for the specific organization.
Step 6: Build the evidence collection plan
Owner: Business analyst.
The business case is a prediction. The evidence collection plan defines how you will measure whether the prediction was accurate after deployment.
| Metric | Pre-deployment source | Post-deployment source | Frequency | Owner |
|---|---|---|---|---|
| Task completion rate | Baseline report | AI system logs + manual tracking | Weekly | Process owner |
| Error rate | Baseline report | Quality audit sampling | Weekly | Quality lead |
| Processing time per document | Baseline report | System timestamps | Weekly | Technology lead |
| AI platform cost | N/A | Vendor invoice or usage report | Monthly | Finance partner |
| Human review rate | N/A | Review queue logs | Weekly | Process owner |
| Team satisfaction | Pre-deployment survey | Post-deployment survey | Quarterly | HR partner |
| Customer impact | Baseline report | Claims adjuster feedback | Monthly | Process owner |
Output: Evidence collection plan with metric definitions, data sources, collection frequency, and responsible parties.
Step 7: Assemble the business case document
Owner: Business analyst.
The business case document should follow this structure:
- Executive summary: Target process, investment required, expected ROI range, break-even timeline, recommendation.
- Scope definition: Process description, team, task boundary, exclusions.
- Baseline measurement: Methodology, data, current cost.
- Cost model: Current vs AI-augmented with all assumptions.
- ROI calculation: Three scenarios with break-even analysis.
- Risk assessment: What could reduce the benefit or increase the cost, with likelihood and mitigation.
- Evidence collection plan: How results will be measured post-deployment.
- Recommendation: Proceed, defer, or decline, with conditions.
Output: Business case document ready for executive review.
Decision gate: Executive sponsor reviews the business case and confirms it meets the organization's investment approval criteria (hurdle rate, strategic alignment, risk tolerance) before submission for board approval.
Communicating uncertainty to executive reviewers
The three-scenario ROI framework (pessimistic, base, optimistic) gives executive reviewers visibility into the range of outcomes, but the range alone does not communicate which outcome is most likely or what drives the spread between scenarios. Add a brief sensitivity analysis to the business case document that identifies which two or three assumptions create the most variance between the pessimistic and optimistic scenarios.
For the document processing example, the largest variance drivers are the AI task completion rate (50% vs 85% accounts for most of the benefit difference) and the adoption timeline (Month 3 vs Month 8 break-even). A sensitivity table that shows how the break-even month changes if only the task completion rate varies (holding all other assumptions at base) is more useful to an executive reviewer than the full three-scenario table, because it identifies where the investment risk actually concentrates.
Frame uncertainty as a monitoring and decision commitment, not as a hedge. Rather than saying "results may vary," specify: "If the Week 8 task completion rate is below 60%, we will pause deployment expansion and conduct a root cause review before proceeding." This converts uncertainty into a named decision trigger that the executive can hold the team accountable for.
Risk register and sensitivity analysis
A business case without a risk register is not a complete investment document. For each assumption in the cost model, identify the risk that the assumption is wrong, the direction of the error (cost overrun or benefit shortfall), and the mitigation.
| Assumption | Risk if wrong | Direction | Mitigation |
|---|---|---|---|
| AI task completion rate (70% base) | Model performs worse than expected on production data | Benefit shortfall | Run a 30-day controlled pilot before committing full deployment cost; measure actual task completion rate against the 70% assumption before scaling |
| Integration cost (on budget) | Integration complexity is higher than estimated | Cost overrun | Add a 20% contingency to integration cost in the pessimistic scenario; require the technology lead to provide a range, not a point estimate |
| Human review rate (25% base) | Reviewers reject more AI outputs than modeled | Both: higher review cost and lower labor savings | Monitor the actual review rate in the first 30 days post-deployment; use it to recalibrate the cost model before the first post-deployment business case review |
| Adoption timeline (4 months base) | Team adopts more slowly than expected due to change resistance | Benefit shortfall delayed | Build the 90-day change management plan before deployment and account for the productivity dip in the Year 1 benefit calculation |
| Error reduction (40% base) | AI error rate is higher than the baseline human error rate for certain task types | Cost increase | Stratify the baseline error measurement by task type; identify whether the AI performs better or worse for each type before modeling an aggregate error reduction |
Present the risk register alongside the ROI summary table so that executive reviewers can see which assumptions drive the most risk. The finance partner validates not only the calculations but also the reasonableness of the assumption ranges.
Failure modes
Building the business case after the decision is made. If the organization has already decided to deploy AI and the business case is a formality, it will lack rigor and will not serve as a useful post-deployment measurement tool.
Counting displaced headcount as savings without a plan. If the business case assumes 12 people will be redeployed, the savings are only real if those people are actually redeployed to productive work or if positions are eliminated through attrition. State the plan explicitly.
Ignoring ongoing costs. AI systems require monitoring, maintenance, model updates, and ongoing human review. A business case that includes only the deployment cost and the annual benefit overstates the ROI.
Using vendor-provided ROI projections. Vendor projections are marketing tools, not business cases. Build your own model from your own baseline data.
Done when
- Cost model is validated by finance with documented assumptions
- Baseline measurements are complete with recorded methodology
- ROI shows three scenarios with break-even timeline for each
- Evidence collection plan defines metrics, measurement, frequency, and owners
- Executive sponsor has confirmed the business case meets approval criteria
Next step
Submit the business case through your organization's investment approval process. After approval, begin the evidence collection plan immediately so you have a clean measurement of pre-deployment baseline before any process changes begin.
Ampity builds custom AI workforce solutions with measurable outcomes and defined acceptance criteria. To discuss your AI workforce business case, visit our Custom AI Workforce service page.
Presenting to a skeptical finance reviewer
Before submitting, confirm the business case answers the specific questions your finance reviewer will raise. The most common objections are: what happens if AI output quality is lower than projected, how the savings interact with existing headcount plans, and whether technology costs are capital or operating expenditure. Preparing written answers to these questions before the submission meeting prevents delays and signals that the team built the case rigorously rather than optimistically.
Primary references
- NIST AI Risk Management Framework, source checked 2026-11-05
- AWS Bedrock Responsible AI, source checked 2026-11-05
- Amazon Bedrock Agents documentation, source checked 2026-11-05
- Amazon Bedrock monitoring documentation, source checked 2026-11-05
Related resources
Which AI Pilot Is Worth Running? Decision Value, Exposure and Adoption
Compare no pilot, shadow replay, human assistance and limited live use using decision-reversal evidence, separate review capacity and honest adoption denominators.
A Model Benchmark Is Not an AI Integration Estimate
Reconcile an AWS AI benchmark budget with the identity, data, application, release and operating work needed for a bounded implementation.
AI Workforce Operating Model Design: Role Definitions and Human-AI Task Boundaries
A step-by-step playbook for operations directors and transformation leads to design an AI workforce operating model: covering role definitions, task routing rules, escalation paths, and boundary documentation as a governance artifact produced before deployment.
2027 Enterprise AI Workforce Planning Framework
A planning framework for CEOs, COOs, and Chief People Officers preparing enterprise AI workforce transformation, covering workforce role evolution, process redesign priorities, risk and governance posture, and infrastructure readiness assessment, framed as planning guidance not predictions.