Operations: Measuring AI Task Completion Rate Against Human Baseline
A measurement framework for operations managers to compare AI task completion rate against a human performance baseline, covering task definition, baseline method,...
Measuring AI task completion rate against a human baseline is the foundational step in demonstrating that an AI workforce deployment adds operational value. Without a valid baseline and a structured comparison period, any performance claim is anecdotal. This article defines a measurement framework that operations managers can use to design the baseline, run the comparison, and report the result.
Why task completion rate matters separately from cost
Cost per completed task measures efficiency, how much you spend to get a unit of output. Task completion rate measures coverage, what fraction of incoming tasks the AI handles to an accepted standard. These are different metrics and can move in opposite directions.
A system might complete tasks cheaply but only handle 40 percent of incoming volume, leaving the rest to human queues. Another system might handle 90 percent of volume at a higher per-task cost. An operations manager who measures only cost misses the coverage story. One who measures only coverage misses the economics.
Tracking both together gives a complete operational picture. This article focuses on completion rate methodology; see the AI cost-per-completed-task resource for the cost side.
Defining a task for measurement
The first requirement for a valid completion rate is a precise task definition. Vague definitions produce numbers that look positive but do not hold up to scrutiny.
A well-defined task has four attributes:
A clear trigger. What event starts the task? Examples: an email arrives in a monitored inbox, a document is uploaded to a processing queue, a form is submitted, or a database record changes.
A clear completion criterion. What must be true for the task to count as complete? This should be observable without manual review of every output. Examples: a structured record is written to the target system with all required fields populated; a reply is sent and no escalation flag is raised within two hours; a document is classified and routed to the correct destination folder.
A defined quality threshold. What error rate on the completion criterion is acceptable? A task that completes technically but produces wrong output should not count. Define the acceptable error rate before measurement starts.
An explicit scope boundary. Which task variants are in scope? A document processing team might handle invoices, purchase orders, and contracts. If the AI handles only invoices, the measurement scope should say so. Measuring AI coverage across all document types when it was only deployed for invoices produces a misleading completion rate.
Establishing the human baseline
The human baseline is the completion rate your team achieved before the AI was introduced, measured under the same task definition and quality threshold.
Baseline measurement period
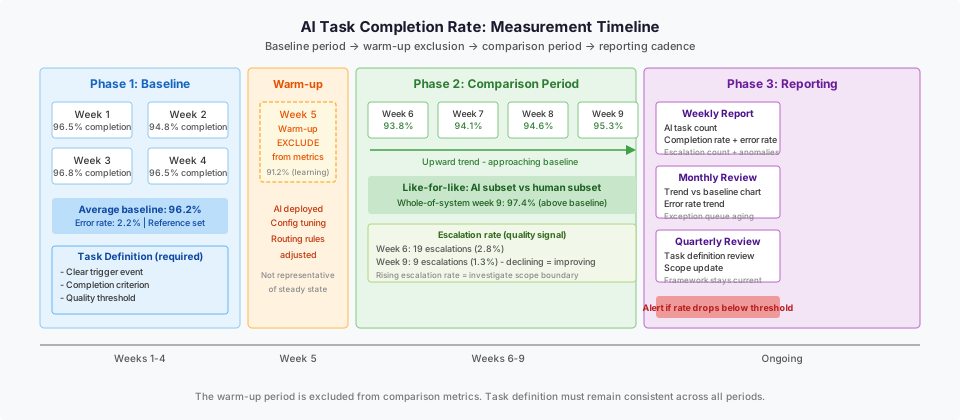
Select a baseline period that is representative of normal operations. Avoid periods with unusual volume events (peak seasons, system outages, or staff shortages) unless those conditions are typical. A four-to-six-week baseline period is usually sufficient to capture normal variation without taking so long that the measurement delays deployment.
For the document processing example used throughout this article: the baseline period is a standard four-week period with no seasonal volume spike. The team is a six-person document classification team handling incoming vendor invoices.
What to measure in the baseline
For each week in the baseline period, record:
| Metric | Definition |
|---|---|
| Total tasks received | Count of tasks entering the queue by trigger event |
| Tasks completed by humans | Count of tasks reaching the completion criterion within the SLA window |
| Tasks not completed | Tasks that expired, were escalated without resolution, or were returned as outside scope |
| Completion rate | Tasks completed / tasks received |
| Error rate | Tasks completed but failing a quality check / tasks completed |
| Average completion time | Time from trigger to completion criterion |
For the invoice team example, the baseline shows:
| Week | Tasks received | Tasks completed | Completion rate | Error rate |
|---|---|---|---|---|
| 1 | 820 | 791 | 96.5% | 2.1% |
| 2 | 847 | 803 | 94.8% | 2.4% |
| 3 | 801 | 775 | 96.8% | 1.9% |
| 4 | 833 | 804 | 96.5% | 2.2% |
| Average | 825 | 793 | 96.2% | 2.2% |
The human baseline completion rate is 96.2 percent with a 2.2 percent error rate. These become the reference values the AI must meet or exceed to demonstrate operational parity.
Designing the AI comparison period
After the AI system is deployed, you need a comparison period that is long enough to show steady-state behavior and short enough to generate a decision within a reasonable timeframe.
Warm-up period
Do not measure AI performance during the first week of deployment. Early AI operation often involves prompt adjustments, routing rule corrections, and configuration changes that do not represent the system's intended steady state. Mark this period as a warm-up and exclude it from the comparison metrics.
Comparison period length
Measure for at least four weeks after the warm-up period. Use the same task definition, quality threshold, and SLA window you used in the baseline. This ensures you are comparing the same thing.
Mixed-team considerations
In most deployments, the AI handles a portion of the task volume and humans handle the rest (exceptions, escalations, out-of-scope variants). Record which tasks were handled by AI, which by humans, and which were AI-initiated but human-resolved (escalations).
For the invoice team example, the AI is configured to handle invoices that match a set of vendor templates and fall within defined field confidence thresholds. Invoices outside these parameters are routed to the human exception queue.
| Week | AI tasks | Human tasks | Escalations from AI | AI completion rate | Human completion rate |
|---|---|---|---|---|---|
| 5 (warm-up) | 614 | 211 | 32 | 91.2% | 95.7% |
| 6 | 668 | 157 | 19 | 93.8% | 97.1% |
| 7 | 671 | 154 | 14 | 94.1% | 96.9% |
| 8 | 683 | 147 | 11 | 94.6% | 97.2% |
| 9 | 690 | 135 | 9 | 95.3% | 97.8% |
The AI task completion rate trends upward from week 6 to week 9 as the system processes more examples and routing rules are refined. By week 9 it reaches 95.3 percent, approaching the human baseline of 96.2 percent.
Comparison methodology
The comparison is not simply AI completion rate versus human baseline rate. You need to account for scope: the AI was given a subset of tasks (template-matched invoices within confidence thresholds) and the humans handled the exception queue. A fair comparison requires either comparing like-for-like subsets or reporting the whole-of-system rate.
Like-for-like comparison
If you have historical data on the baseline team's performance on the specific subset of tasks the AI now handles, compare those numbers directly. If not, acknowledge that the AI is handling the cleaner portion of the task volume and the human comparison should be from the exception queue, not the full baseline.
Whole-of-system rate
Add AI completions and human completions together, then divide by total tasks received. This measures the operational result regardless of which actor produced it. For week 9 of the example: (690 + 135 - 9 escalations resolved) / 834 total incoming = 97.8 percent whole-of-system completion rate. This is higher than the human-only baseline of 96.2 percent, which suggests the deployment is adding operational coverage rather than degrading it.
Reporting cadence
Once the comparison period ends, establish a steady-state reporting cadence:
Weekly operational report: AI task count, completion rate, error rate, escalation count, and any anomalies. This is the signal for the operations manager to detect problems early.
Monthly performance review: Trend chart of AI completion rate versus baseline, error rate trend, human exception queue size and aging. This is the signal for management to assess whether the deployment is tracking toward, meeting, or exceeding baseline.
Quarterly model review: Assessment of whether the task definition, quality threshold, or scope needs to be updated as the task environment changes (new vendor invoice formats, new task types, changed SLA). This prevents the measurement framework from going stale.
Diagram: measurement timeline
See the accompanying diagram (operations-measuring-ai-task-completion-baseline-desktop.svg) showing the baseline period, warm-up period, comparison metrics collection, and weekly reporting cadence with go/no-go assessment points.
Failure modes
Measuring during the warm-up period. Week 1 AI performance is not representative. Including it in the comparison understates true AI capability or creates a misleading trendline.
Using different task definitions for baseline and comparison. If the task completion criterion changes between baseline and comparison, you are not measuring the same thing. Document any changes and treat them as a scope change that requires a new baseline segment.
Measuring AI against total human volume when AI only handles a subset. AI completion rate across AI-routed tasks is different from AI completion rate across all incoming tasks. Report both numbers with clear labels so stakeholders understand what is being compared.
Ignoring escalation volume as a signal. A declining escalation rate from AI to human is a positive quality indicator. A rising escalation rate signals that the AI is encountering task variants it was not designed for. Track escalation rate alongside completion rate.
Waiting too long to establish a baseline. Organizations that deploy AI before measuring human performance have no reference point. Establish the baseline before deployment begins, even if it means a short delay.
What to do next
The next useful step is defining the task with precision before the baseline measurement period begins. The definition must include trigger, completion criterion, quality threshold, and scope boundary. Use the measurement framework above to structure both the baseline period and the comparison period with consistent metrics.
For the broader governance design that determines what AI is permitted to handle, see the AI Workforce Operating Model Design playbook. For cost measurement alongside completion rate, see the AI cost-per-completed-task resource.
The Custom AI Workforce service page describes how Ampity designs and deploys AI workforce systems including measurement frameworks.
Primary references
- AWS Bedrock Responsible AI, source checked 2026-11-05
- Amazon Bedrock monitoring documentation, source checked 2026-11-05
Related resources
Token Cost Is Not Cost per Completed AI Task
Measure AI workflow costs against verified completion, including retries, retrieval, human review and recovery. Compare changes without hiding failures.
An AI Tool Returned Success. Did the Business Task Finish?
Define completion beyond a successful tool response. Map receipts, downstream outcomes and partial failure to evidence your AI workflow can report honestly.
AI Workforce Operating Model Design: Role Definitions and Human-AI Task Boundaries
A step-by-step playbook for operations directors and transformation leads to design an AI workforce operating model: covering role definitions, task routing rules, escalation paths, and boundary documentation as a governance artifact produced before deployment.