Executive Reporting: Board-Level AI Risk Posture and Business Value Framework
How CTOs, CIOs, and Chief AI Officers should design a quarterly board report on AI risk posture and business value, covering value metrics, risk indicators, incident...
Boards are asking about AI. The question is what a CTO or CIO should actually put in front of them: not a demo, not a list of tools adopted, and not a press release summary dressed as strategy. The board needs a basis for three decisions: whether the organization is capturing appropriate business value from AI investments, whether the risk exposure is understood and managed, and whether further investment is warranted.
A quarterly AI board report built around those three decisions is a repeatable, defensible artifact. This article describes how to design it.
What a board needs versus what executives typically present
The disconnect between what executives present and what boards can act on is common. The typical presentation covers use cases deployed, tools purchased, and pilot results highlighted for enthusiasm. This does not give the board the information it needs.
What boards can act on:
- Business value delivered relative to investment: specific, measurable, time-bounded.
- Risk indicators that require board-level awareness or decision: material exposures, incidents with business consequence, and open governance gaps the board should know exist.
- Investment decisions pending that require board direction or approval.
What boards cannot act on:
- Lists of AI tools without connecting them to business outcomes.
- Enthusiastic case studies without baseline or measurement.
- Risk language that is generic ("we are monitoring AI risks") without specific indicators or actions.
The board report framework below structures information around what can be acted upon.
Report structure: three sections
Section 1: Business value delivered
This section shows what AI investments produced in the reporting period. Use three value metrics that connect directly to the organization's strategic priorities.
Metric selection criteria. A business value metric for board reporting should be:
- Measured with a clear definition (what counts, what does not)
- Compared to a baseline or prior period
- Attributed to AI investment specifically (not confounded by other concurrent changes)
- Expressed in business terms (revenue, cost, cycle time, volume) rather than technical terms (tokens processed, model accuracy)
Example value section for a quarterly board report:
| Value metric | Baseline | Current quarter | Change |
|---|---|---|---|
| Documents processed per week (operations) | 3,200 (human team, Q2 baseline) | 5,100 (AI-assisted) | +59% volume at same headcount |
| Average contract review cycle time | 11 days (pre-AI average) | 7 days (Q3 with AI-assisted drafting) | -36% cycle time |
| Customer inquiry deflection rate | 41% (self-service, Q2) | 58% (AI-assisted self-service, Q3) | +17 percentage points |
Each metric should include a brief note on what is not captured: the operations volume metric does not capture error rate or the human review cost added to maintain quality. Present the metric with its limitation, not only the positive number.
Section 2: Risk indicators
This section shows the risk posture for board-level awareness. Present two to three risk indicators, not an exhaustive risk register. The board should see the indicators that require their awareness or decision, with status and action owner.
Risk indicator format:
| Risk indicator | Current status | Trend | Action owner | Board action required? |
|---|---|---|---|---|
| AI output review coverage (% of consequential AI outputs reviewed by a human) | 78% of defined consequential outputs reviewed | Declining (was 84% in Q2) | CISO + Operations VP | Yes - approve additional review capacity or change coverage threshold |
| Access to AI tools by former employees or inactive accounts | 35 accounts revoked in quarterly review; event-triggered review compliance at 71% | Improving | IT Security | No - information only |
| Material AI-related incidents in period | One incident: AI contract draft contained incorrect liability clause not caught in review; caught in legal sign-off | First occurrence this type | Legal + AI Operations | Yes - approve new legal review gate for contract AI drafts |
The risk section should not contain aspirational risk management language. It should contain factual current state, the trend direction, and a clear statement of whether board action is required.
Section 3: Forward investment view
This section presents the one or two investment decisions that require board direction in the next quarter. It is not a strategy presentation; it is a decision item with options, costs, and recommendation.
Decision item format: State the decision required, the options under consideration, the cost range for each option, the risk of inaction, and the management recommendation. Provide enough information for the board to approve, modify, or redirect, but not so much technical detail that the board is managing operations.
Example: "Decision required: Expand AI document processing from invoices to contracts. Option A - extend current AI system (estimated investment X, timeline Y). Option B - procure specialized contract AI tool (estimated investment X, timeline Y). Option C - defer for one quarter and reassess with more data on current system error rate trend. Management recommendation: Option A, subject to legal review gate approval in risk section."
Quarterly cadence discipline
A board report on AI is only useful if it covers the same metrics each quarter with consistent definitions. The board cannot track trends if the metrics change each report. Establish the three value metrics and two to three risk indicators in the first report and change them only when the business context genuinely changes. When a metric changes, explain what it replaced and why.
The report should be producible in two to three days of data collection and drafting. If it takes three weeks to assemble, the data sources and collection process are broken, not the report structure. Fix the data infrastructure so the report can be maintained at operational pace.
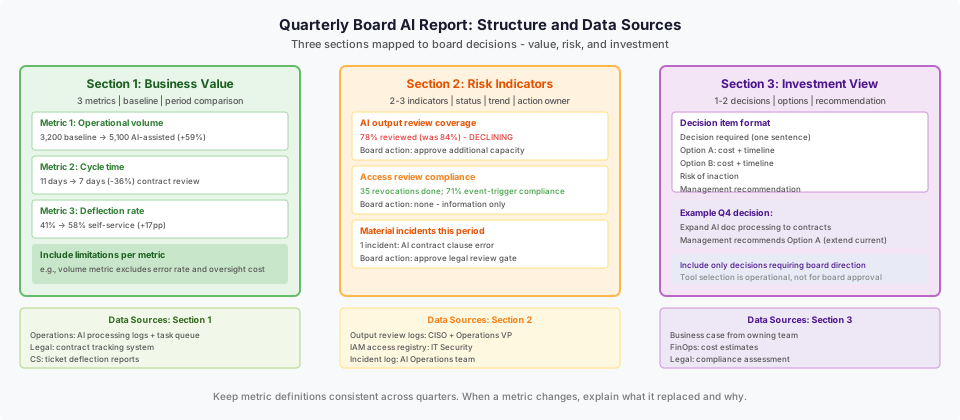
Diagram: board report structure
See the accompanying diagram (executive-ai-risk-value-board-reporting-desktop.svg) showing the three-section report structure with data sources for each section and the decision output format.
What to put in and what to leave out
Include: Metrics with baselines and measurement definitions. Risk indicators with current status, trend, and action owner. Decisions that require board input. Limitations of current measurement.
Leave out: Use case lists without outcomes. Tool counts. Vendor partnership announcements. Aspirational language about AI's future potential. Technical accuracy metrics disconnected from business impact. Incidents that have been resolved with no ongoing board consequence.
The hardest inclusion discipline: Reporting a negative trend honestly. If AI output review coverage has declined from 84 percent to 78 percent, that belongs in the board report as a risk indicator requiring their awareness. The instinct to smooth over declining indicators in executive reporting is understandable but undermines the board's ability to make informed decisions.
Failure modes
Reporting only positive indicators. A board that only sees positive AI metrics cannot assess risk posture. The governance role of the board requires knowing what is not working, not only what is.
Changing metric definitions between reports. If the AI output review coverage metric is redefined between Q2 and Q3, the board cannot assess whether the Q3 figure represents improvement or definitional change. Keep definitions stable and explicitly document any changes.
Using the board report as a tool ratification forum. Individual AI tool decisions should not require board approval. Tool acquisition is an operational decision. The board report should surface strategic-level investment decisions and governance questions, not tool selection.
No action items. A board report that closes with no decisions required and no actions is either complete (and genuinely uneventful) or is filtering out the information the board needs. If every quarter is uneventful, the reporting framework may be missing real risks.
What to do next
The next useful step is defining the three value metrics and two risk indicators before the first board report. Confirm you can produce baseline data for each metric. Identify the data owner for each metric and the cadence at which they will update the data for the quarterly report cycle.
For the underlying governance framework that the risk indicators draw from, see the AI governance framework resource. For governance audit procedures, see the Enterprise AI Governance Audit playbook.
The Custom AI Workforce service page and AWS Consulting service page describe how Ampity supports enterprise AI governance design and reporting.
Primary references
- NIST AI Risk Management Framework (NIST AI 100-1), source checked 2026-11-05
- AWS Bedrock Responsible AI, source checked 2026-11-05
Related resources
AI Governance Framework: Production Decisions, Controls and Evidence
Build proportionate AI governance with a decision inventory, a worked routing example, release evidence, calibrated monitoring and explicit stop conditions.
Enterprise AI Governance Audit: Policy Inventory, Access Review, Output Sampling
An execution guide for compliance officers and internal audit teams conducting an enterprise AI governance audit: covering policy inventory, access review, output sampling, risk rating, and findings documentation.
Related services
Custom AI Workforce Engineering and Management
Ampity engineers and manages AI employees with defined jobs, business-system access and proactive workflows. Onboard, validate and delegate authorised work.
AWS Consulting & Migration Services
AWS consulting for architecture and Well-Architected reviews, cost optimisation, FinOps and migration. Plan changes around workload evidence and recovery needs.