AWS Native FinOps vs Third-Party Platforms: When Cost Explorer Is Enough
Compare AWS native cost management tools with third-party FinOps platforms across allocation, anomaly detection, forecasting, and showback. Includes decision criteria...
AWS provides a set of native cost management tools: Cost Explorer, Budgets, Cost Anomaly Detection, Cost and Usage Reports (CUR), and Cost Categories. These tools are available to every AWS customer and cover the core FinOps functions of visibility, allocation, optimization, and governance. Third-party FinOps platforms such as CloudHealth, Apptio Cloudability, Kubecost, and Vantage provide additional capabilities, integrations, and workflows on top of the raw cost data. The question for most organizations is not whether native tools work, but whether they are sufficient for your organization's specific allocation, reporting, and optimization needs.
Source: AWS Cost Management, AWS Cost Explorer documentation, checked 2026-11-05.
What AWS native tools provide
Cost Explorer
Cost Explorer provides a visual interface to analyze cost and usage data. You can filter by service, account, tag, Region, and other dimensions. It supports daily and monthly granularity, historical analysis up to 12 months, and basic forecasting.
Strengths: Free for basic use (API calls have per-request pricing), integrated with all AWS services, no additional vendor relationship needed, real-time data availability.
Limitations: Limited to AWS data only. Custom allocation logic beyond tags requires manual work. Forecasting uses simple trend projection without external context. Dashboard customization is constrained compared to third-party tools.
AWS Budgets
Budgets lets you set spend thresholds and receive alerts when cost or usage is forecasted to exceed or actually exceeds the threshold. You can create budgets by account, service, tag, or custom dimensions.
Strengths: Simple to configure, integrated with SNS for alerting, supports both cost and usage budgets.
Limitations: Limited to threshold-based alerting. Does not provide root cause analysis when budgets are exceeded. Requires manual investigation to understand what drove the cost increase.
Cost Anomaly Detection
Cost Anomaly Detection uses machine learning to identify unusual spending patterns and alert teams. It monitors cost data across services and accounts without requiring manual threshold configuration.
Strengths: Automated detection without manual threshold setting, reduces alert fatigue compared to budget-based alerting, monitors across multiple dimensions simultaneously.
Limitations: Detection granularity is limited. May generate false positives during planned scaling events. Does not integrate with non-AWS cost data.
Cost and Usage Reports (CUR)
CUR provides the most granular cost data available from AWS, delivered as CSV or Parquet files to S3. CUR data includes line-item detail for every resource, hourly or daily, with full metadata.
Strengths: Complete data set for custom analysis, supports Athena and QuickSight integration for custom dashboards, includes amortized and blended cost views.
Limitations: Raw data requires significant engineering effort to process and visualize. Building custom dashboards and allocation reports from CUR data is an ongoing engineering commitment. No built-in workflow automation.
Cost Categories
Cost Categories lets you organize resources into custom groups for cost allocation and reporting. Groups can be defined by tag, account, service, or charge type.
Strengths: Native grouping mechanism that works across Cost Explorer, Budgets, and CUR. No additional tooling required.
Limitations: Rule-based grouping only. Cannot handle complex allocation logic such as proportional sharing of shared services costs.
What third-party platforms add
Third-party FinOps platforms sit on top of AWS cost data (typically ingested from CUR) and provide additional capabilities.
Multi-cloud visibility. If your organization uses AWS, Azure, and GCP, third-party platforms provide a single view across all providers. AWS native tools only cover AWS.
Advanced allocation and showback. Proportional cost sharing, unit economics (cost per customer, cost per transaction), and automated chargeback reports that go beyond tag-based allocation.
Optimization recommendations with automation. Automated right-sizing, Reserved Instance and Savings Plan purchasing recommendations with one-click execution, and idle resource detection with automated remediation.
Custom dashboards and workflows. Richer visualization, role-based dashboards (engineering, finance, executive), and integration with ticketing systems for optimization workflows.
Kubernetes cost allocation. Platforms like Kubecost and CloudHealth provide container-level cost allocation that AWS native tools do not offer natively.
FinOps team workflow support. Collaboration features, optimization tracking, policy enforcement, and FinOps maturity assessment tools.
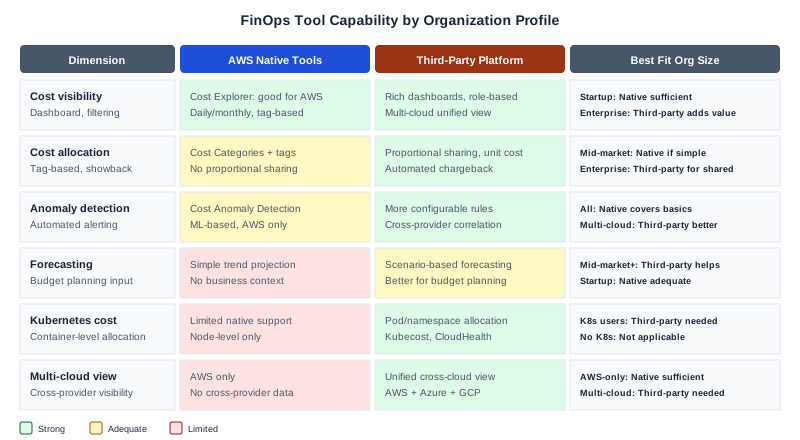
Capability comparison
| FinOps dimension | AWS native | Third-party platform |
|---|---|---|
| Cost visibility | Good for single-account or simple multi-account | Better for multi-cloud or complex organizations |
| Allocation by tag | Supported natively | Supported with additional allocation logic |
| Proportional cost sharing | Not supported natively | Supported with custom rules |
| Anomaly detection | Basic ML-based detection | More configurable, multi-provider |
| Forecasting | Simple trend projection | Scenario-based, business-context-aware |
| Optimization recommendations | Compute Optimizer, Trusted Advisor | Broader coverage with automation |
| Kubernetes cost allocation | Limited | Strong (Kubecost, CloudHealth) |
| Multi-cloud support | AWS only | Cross-provider visibility |
| Custom dashboards | Limited (CUR + QuickSight) | Rich, role-based dashboards |
| Unit economics | Manual calculation from CUR | Built-in unit cost tracking |
Decision by organization profile
Startup (under $50K monthly AWS spend, single cloud)
Recommendation: AWS native tools are sufficient.
Cost Explorer and Budgets provide adequate visibility and alerting at this scale. The engineering effort to implement a third-party platform exceeds the optimization value it would deliver. Focus FinOps effort on tagging discipline and basic budget alerting.
Mid-market ($50K to $500K monthly, growing, single or dual cloud)
Recommendation: Start with native tools; evaluate third-party when allocation complexity outgrows tags.
At this scale, native tools cover visibility and basic optimization. Third-party platforms become valuable when: you need showback reports for multiple business units, your Kubernetes costs need container-level attribution, or your FinOps team needs workflow tooling to manage optimization across teams.
Enterprise ($500K+ monthly, multi-cloud, complex organizational structure)
Recommendation: Third-party platform typically justified.
At enterprise scale, the cost of a third-party platform is small relative to the optimization opportunities it surfaces. Multi-cloud visibility, advanced allocation, and workflow automation provide measurable ROI. The engineering effort to replicate these capabilities from CUR data typically exceeds the platform cost.
Failure modes
Over-investing in tooling before tagging discipline. No FinOps platform compensates for inconsistent tagging. Before evaluating platforms, ensure your resources are tagged with owner, environment, and cost center at minimum.
Choosing a platform based on feature count rather than workflow fit. A platform with 200 features that your team does not use is a wasted investment. Evaluate based on the specific workflows your FinOps team needs.
Ignoring CUR as the foundation. Even with a third-party platform, CUR is the canonical data source. Ensure CUR is configured, delivered to S3, and accessible for custom analysis regardless of which platform you use.
Using Cost Explorer forecasting for budget planning. Cost Explorer forecasting is a trend projection, not a business-context-aware forecast. Do not use it as the sole input for annual budget planning.
Assuming a third-party platform eliminates the need for tagging discipline. No platform creates attribution from untagged resources. Third-party platforms amplify good tagging practices; they do not substitute for them. If your AWS estate has significant untagged spend, resolve the tagging gap before evaluating platforms, or you will buy a tool that surfaces the same unattributable cost your free tools already show.
Underestimating integration effort. Connecting a third-party FinOps platform to CUR, your identity provider, and your internal reporting tools takes engineering time. Budget 2-4 weeks of integration effort before you have usable dashboards from a new platform.
Next step
Audit your current FinOps workflow against the capability comparison above. If native tools cover your needs, invest in tagging discipline and CUR-based custom reporting rather than adding a platform. If you have identified specific gaps (multi-cloud, Kubernetes allocation, showback automation), evaluate platforms against those specific requirements.
Ampity helps organizations implement FinOps practices and optimize AWS spend. To discuss your cost management approach, visit our AWS Consulting service page.
Related resources
Cloud Cost Optimization Beyond Right-Sizing: Data Paths and Storage Design
Find architecture-level cloud costs in repeated reads, network paths and storage lifecycles. Compare alternatives without removing redundancy or weakening recovery.
Enterprise FinOps: Allocation, Forecasting, and Cost Decisions
Build a defensible FinOps operating model: reconcile cloud costs, allocate shared spend, evaluate commitments, and assign decisions without compromising service reliability.
AWS EDP: Publicly Available Signals, Commitment Risk, and What to Raise With AWS
Understand the AWS Enterprise Discount Program as a commitment-based program from publicly available information. Covers commitment risk considerations, qualification signals, and questions to raise directly with AWS.