Data Governance: Ground Truth Labeling Process for Sustained AI Quality
How data governance leads and ML engineers should design a ground truth labeling process to sustain AI output quality in production, covering sample selection,...
A model that performs well at deployment will not necessarily perform well six months later. Data distributions shift. Business rules change. The document types an AI classifier encounters in December may be different from the ones it encountered during training in April. Without a process for continuously checking AI outputs against ground truth, quality degradation is invisible until it surfaces as a customer complaint or business error.
This article defines a ground truth labeling process for sustained AI quality monitoring in production. It covers sample selection, labeler instruction design, inter-rater reliability thresholds, and the cadence for quality metric reporting and drift alerts.
Why production quality monitoring requires ground truth labeling
Automated metrics such as latency, error rate, and throughput measure system behavior, not output accuracy. A model can respond quickly and without errors while producing wrong classifications or poor extractions. Detecting semantic quality degradation requires comparing model outputs against a human-verified correct answer - the ground truth label.
The key distinction is between technical monitoring (is the system running?) and quality monitoring (is the system producing correct outputs?). Both are necessary. This article covers quality monitoring specifically.
Ground truth labeling is the process of selecting a sample of production AI outputs, having qualified reviewers assess whether each output is correct, and using the resulting accuracy signal to detect quality changes over time.
Sample selection
Random sampling of production outputs is the standard approach. The sample must be large enough to detect meaningful quality changes but small enough to be reviewed by the available labeling capacity within the measurement window.
Sample size guidance: For a weekly quality review cycle, a sample of 50-100 outputs per model task type is typically sufficient to detect accuracy changes of 5 percentage points or more with reasonable confidence. Smaller samples reduce labeling cost but increase the chance of missing real quality shifts.
Stratified sampling: If the model processes multiple input types (for example, a document classifier handling invoices, purchase orders, and contracts), sample from each type proportionally. A sample composed entirely of the most common input type will miss quality problems in less common types.
Edge case oversampling: Add a fixed number of edge case samples from outputs that scored near the confidence boundary (where the model expressed low confidence). These cases are more likely to contain errors and provide early signal of boundary behavior degradation.
Excluding warm-up data: For newly deployed models or models that received a configuration change, exclude the first week of post-change outputs from the regular quality sample and treat them separately as a change validation set.
Labeler instructions
Labeler instructions must be specific enough that two reviewers independently reviewing the same output reach the same conclusion. Vague instructions produce inconsistent labels that cannot be aggregated into a reliable accuracy metric.
A labeler instruction document should include:
Task definition. What is the AI model supposed to do? Example: "classify this invoice into one of five vendor categories: utilities, software, professional services, equipment, or other."
Correct answer criteria. For each possible output class or value, provide explicit criteria. Example: "classify as 'software' if the invoice line items describe software licenses, SaaS subscriptions, or software support contracts, regardless of the vendor name."
Ambiguity handling rules. What should a labeler do when the correct answer is genuinely unclear? Options include: assign the most likely class and flag the case as ambiguous; assign "unclear" as a special label; or escalate to a subject matter expert. The choice should be documented, consistent, and tracked.
Examples. Provide at least two positive and two negative examples for each class. For the invoice classifier: an invoice from a telecommunications provider should be classified as "utilities" even though the vendor is a technology company, because the service delivered is network connectivity, not software.
Out-of-scope markers. What constitutes an output that cannot be meaningfully labeled? Example: invoices that are not in the expected language, or documents that are not invoices at all. Label these as "out-of-scope" rather than forcing them into a class.
Inter-rater reliability threshold
Inter-rater reliability (IRR) measures the degree of agreement between two or more independent labelers reviewing the same outputs. High IRR means the labeling instructions are clear and the task is well-defined. Low IRR means the instructions are ambiguous or the task genuinely contains cases where reasonable reviewers disagree.
Calculating IRR: For categorical labels, Cohen's kappa is a standard measure. It ranges from -1 to 1, where 1 is perfect agreement, 0 is agreement at chance level, and negative values indicate worse-than-chance agreement. For quality monitoring purposes, a kappa of 0.7 or higher is a reasonable threshold for tasks where the classes are clearly defined.
Running the IRR check: Select 10-15 percent of the weekly sample for dual labeling (each output reviewed by two independent labelers without seeing each other's label). Calculate kappa on this subset. If kappa falls below the threshold, review the labeler instructions for the cases where disagreement occurred and revise before the next labeling cycle.
IRR as a leading indicator: A declining IRR before accuracy drops can indicate that production inputs are becoming more ambiguous or that the labeler instructions no longer cover the input distribution. Address instruction gaps proactively rather than waiting for the accuracy metric to degrade.
Worked example: document classification model
A document classification model is deployed to classify incoming vendor documents into five categories. The team runs a weekly quality review cycle.
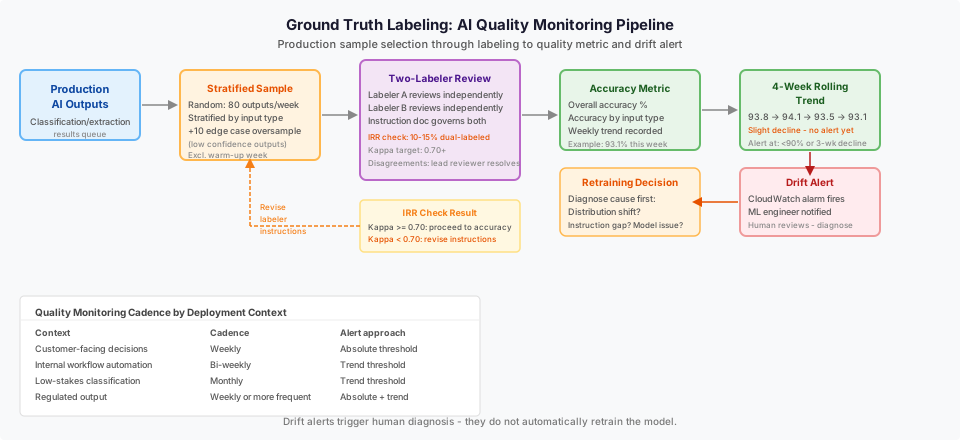
Sample selection: Each week, 80 documents are randomly selected from the production classification queue. The sample is stratified: 40 from the highest-volume category (invoices), 20 from the second-highest (purchase orders), 10 from contracts, and 10 from the edge-case oversampling pool (outputs where model confidence was below 0.65).
Labeling: Two trained reviewers independently label the 80 samples using the standard instruction document. Twelve of the 80 are dual-labeled for IRR calculation.
IRR check: Cohen's kappa for the dual-labeled subset is 0.81 this week, above the 0.70 threshold. The instructions are clear for this week's sample.
Accuracy calculation: After labels are reconciled (disagreements resolved by a lead reviewer), the team calculates accuracy for each category and overall. This week's overall accuracy is 93.1 percent.
Trend tracking: The team records 93.1 percent against the previous four weeks: 93.8, 94.1, 93.5, 93.1. The trend is slightly declining. No drift alert is triggered yet (the alert threshold is set at 90 percent or three consecutive weeks of decline).
Drift alert setup: The team uses a CloudWatch metric to track the weekly accuracy score. An alarm is configured to alert the ML engineer if accuracy drops below 90 percent, or if the rolling three-week average declines by more than 2 percentage points from the four-week rolling baseline. This alert does not automatically retrain the model; it triggers a human review to diagnose whether the decline is a data distribution shift, a labeling instruction gap, or a model quality problem requiring retraining.
Diagram: quality monitoring pipeline
See the accompanying diagram (data-governance-ground-truth-labeling-ai-quality-desktop.svg) showing the production output sample through labeling to quality metric calculation and drift alert, with feedback paths to the instruction update and model retraining decision.
Quality metric cadence
Match the reporting cadence to the business consequence of quality degradation. A model that makes customer-facing decisions should be reviewed more frequently than a model that produces internal summaries.
| Deployment context | Recommended cadence | Alert threshold approach |
|---|---|---|
| Customer-facing decisions | Weekly or bi-weekly | Absolute threshold (e.g., accuracy below 90%) |
| Internal workflow automation | Bi-weekly or monthly | Trend threshold (e.g., 3% decline over 4 weeks) |
| Low-stakes classification | Monthly | Trend threshold |
| Regulated output | Weekly or more frequent | Both absolute and trend |
Failure modes
Single-labeler design. A single reviewer's labels carry their individual biases and blind spots. Without a second labeler, there is no way to know whether the accuracy metric reflects the model or the labeler's interpretation.
Labeler instructions that become stale. The document classification task changes when new document types appear. If the instructions are not updated to cover new types, labelers will force them into the nearest existing class and the accuracy metric will appear stable while actually reflecting labeler guesswork.
Sampling only confident outputs. Excluding low-confidence outputs from the sample removes the cases most likely to contain errors. This produces an artificially high accuracy metric that does not reflect the model's true production quality distribution.
Alert thresholds set too tight. An alert threshold set at 1 percent below the launch accuracy will generate false alarms from normal weekly variation and train the team to ignore alerts. Set thresholds that represent operationally meaningful degradation.
What to do next
The next useful step is defining the task precisely before designing the labeler instructions. Write the instructions, run them against a small test set with two independent labelers, and measure IRR before the first production labeling cycle. If IRR is below 0.70, revise the instructions until it is not.
For the broader data quality considerations before an AI pilot, see the data readiness resource. For model evaluation design, see the Amazon Bedrock Model Evaluation documentation.
The LLM and RAG Systems service page describes how Ampity designs and maintains quality monitoring frameworks for production AI systems.
Primary references
- Amazon SageMaker Ground Truth data labeling documentation, source checked 2026-11-05
- Amazon Bedrock Model Evaluation documentation, source checked 2026-11-05
Related resources
Data Readiness for Generative AI: An Evidence Checklist
Assess whether an information corpus is safe and useful enough for a generative AI system across rights, access, quality, retrieval, freshness, deletion and evaluation.
When an AWS AI Pilot Has Learned Its Acceptance Test
Identify evaluation contamination from prompt edits, case-family leakage and repeated winner selection. Preserve useful regression evidence and plan a genuinely unseen comparison.
Sample Rare, Consequential Errors in an AWS AI Pilot
Separate representative sampling from enriched challenge sets. Reconcile risk-slice denominators and interpret zero observed errors without claiming that rare failures cannot occur.