Investigate DynamoDB Throttling Before Changing Capacity
Capture throttling reasons, resolve the table or GSI, correlate resource-specific metrics and produce a bounded mitigation decision with stop and reversal gates.
1. Establish the task and its limits
Do not respond to every DynamoDB throttle by increasing table capacity. First identify the operation, the affected resource and the kind of limit. A write sent to a table can be throttled because one global secondary index (GSI) cannot accept its updates. Increasing the wrong resource adds cost without testing the explanation.
This procedure investigates a regional table and its GSIs using an existing application incident. It does not generate production load, scan business records, change keys, delete indexes or execute capacity changes. Global-table replication incidents, transaction cancellation details, local secondary index constraints and service-control-plane throttling need their own follow-up. Record them if encountered; do not force them into this decision tree.
The incident lead supplies the business operation, incident identifier, UTC start and end, allowed evidence location and current severity. The application owner supplies offered work, successful completions, rejected or expired work, request latency and the deployed SDK/retry configuration. An eventual retry success is different from an operation completed within its business deadline.
Output and gate: an incident envelope with a named owner and a finite collection window. Stop if authorization, resource identity or the permitted data boundary is unclear. Use the broader database scaling decision playbook only after this investigation identifies the DynamoDB-specific constraint.
2. Separate diagnostic access from change authority
The DynamoDB operator uses a short-lived approved session. For the read-only commands below, the security reviewer permits dynamodb:DescribeTable on the named table and cloudwatch:GetMetricStatistics under the applicable CloudWatch authorization model. The identity readback uses sts:GetCallerIdentity. Application-log access is a separate permission and may expose customer data. Do not request administrator access because one query is denied.
Confirm the expected account, principal and Region before collecting metrics. A CloudWatch query in another Region can return no datapoints without proving anything about the incident. Do not override endpoints, disable certificate verification or turn on broad debug output to troubleshoot a permission problem.
The cost approver sets a maximum diagnostic collection window and API-query budget. Optional Contributor Insights, application logging changes, capacity increases and a sandbox load test each need their own cost and privacy approval. This playbook supplies no universal price estimate. Capture the applicable regional pricing and proposed traffic before approving spend.
Output and gate: access and cost record, including denied capabilities and permitted retention. Diagnostic roles must not gain UpdateTable, data-plane writes or index deletion as a convenience. This is an authority requirement, not a claim that these examples constitute a complete IAM policy.
3. Capture the failure before interpreting a graph
The application engineer extracts sanitized error records from the approved window: UTC timestamp, API operation, exception name, request identifier, each available throttling reason and its resource ARN. Keep retry-attempt count and final application outcome alongside the service error. Preserve the original field names from the deployed SDK; adapters can change their presentation.
AWS's diagnosing throttling guide describes ThrottlingReasons entries with a reason and resource. Decompose the reason into table/index, read/write and the limit category. Process all entries, not just the first. Missing reason fields are an evidence gap, not proof of a hot partition.
For batch APIs, the application engineer also inspects UnprocessedItems or UnprocessedKeys. A response can contain unfinished items even when the batch call did not throw the exception the log dashboard counts. Review the actual client wrapper before adding another retry loop. AWS documents batch error handling and SDK retries.
Output and gate: a sample failure record tied to an application operation. Do not replay the original write to obtain a better error message. If logs omit the diagnostic fields, propose a narrowly scoped instrumentation change through the application owner and label historical diagnosis provisional.
4. Resolve the ARN and current configuration
The operator matches the error ARN to the approved table inventory. An ARN ending in /index/StatusIndex identifies that GSI; it is not an instruction to investigate only the base table. Record the index key schema separately from the table schema.
These read-only shell examples use explicit illustrative inputs. Replace them with reviewed values. The dates must surround the actual incident and stay within the metric retention/resolution rules. Commands display results; save approved outputs through your evidence-handling process, not an unreviewed shared terminal transcript.
DIAG_PROFILE='approved-diagnostic-profile'
DIAG_REGION='ap-south-1'
DIAG_TABLE='reviewed-table-name'

aws sts get-caller-identity --profile "$DIAG_PROFILE" --no-cli-pager

aws dynamodb describe-table \
  --profile "$DIAG_PROFILE" --region "$DIAG_REGION" \
  --table-name "$DIAG_TABLE" --output json --no-cli-pager
Inspect TableArn, TableStatus, billing mode, throughput settings, any configured on-demand maximum, warm-throughput fields when present, and every relevant GSI's ARN, status, keys and capacity settings. Preserve the complete permitted metadata rather than inferring mode from one numeric field. DescribeTable documents these outputs.
Current metadata is not historical configuration. The incident lead obtains the relevant deployment/change record and notes any autoscaling or operator change during the window. Output and gate: resource map plus configuration timeline. Stop metric interpretation when the returned ARN does not match the incident; resolve the mismatch first.
5. Follow the resource-specific failure path
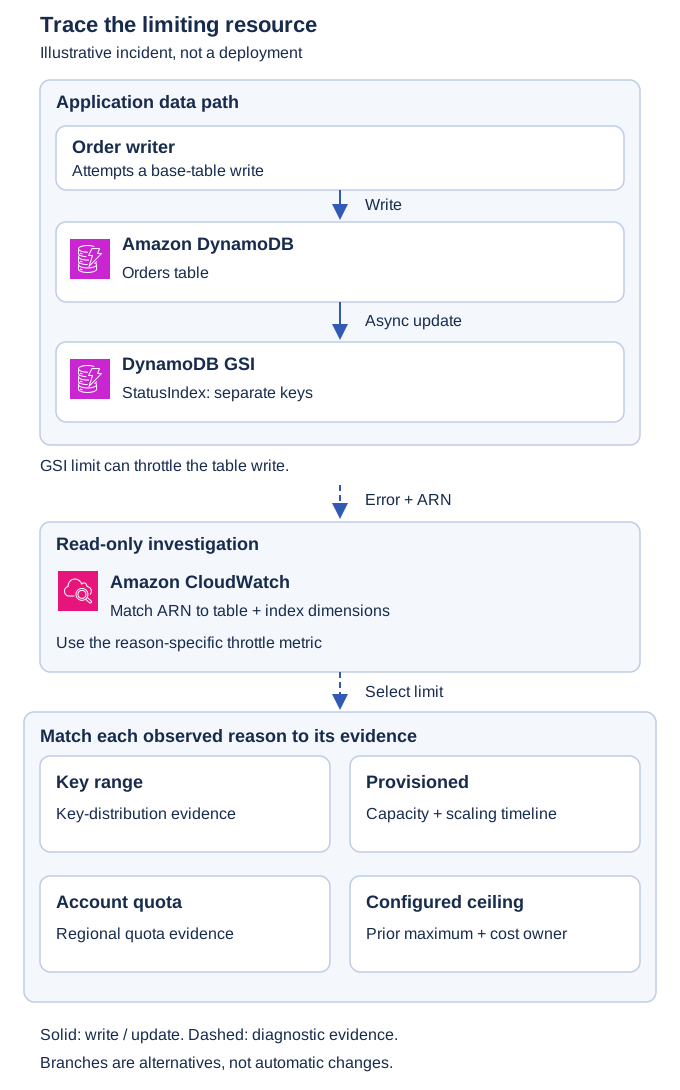
Illustrative incident path, not an observed deployment. The GSI has its own partition distribution. Dashed evidence flow is not a second application write. The four limit branches require different evidence; none authorizes an automatic change.
The useful distinction is between the caller's target and the resource causing the limit. AWS explains GSI write back-pressure: index updates are asynchronous, but insufficient GSI capacity can throttle base-table writes. Table and GSI partitioning can differ.
The operator records a row per observed reason. The application engineer checks whether different operations or resources fail in the same window. One reason does not establish the cause of every application timeout. Output and gate: the resource-specific branch selected from captured evidence, with unresolved errors kept outside that branch.
6. Retrieve matching CloudWatch evidence
The operator chooses the read or write metric from the reason. For a table metric use TableName; for a GSI metric use both TableName and GlobalSecondaryIndexName. Retrieve the corresponding reason-specific metric and consumed-capacity series in the same window. Do not add an index dimension to a table query or omit it for a GSI.
| Reason suffix | Metric stem after Read or Write | Additional question |
|---|---|---|
KeyRangeThroughputExceeded | KeyRangeThroughputThrottleEvents | Is demand concentrated or moving through a key range? |
ProvisionedThroughputExceeded | ProvisionedThroughputThrottleEvents | What provisioned setting applied to this resource then? |
AccountLimitExceeded | AccountLimitThrottleEvents | Which regional service quota constrains this table or index? |
MaxOnDemandThroughputExceeded | MaxOnDemandThroughputThrottleEvents | Which user-configured maximum was in effect? |
For AccountLimitExceeded, identify the on-demand table or individual GSI's account-set regional throughput maximum. Do not substitute aggregate account consumption or a provisioned-capacity setting for that resource-specific quota evidence.
For the illustrative index-write key-range branch:
DIAG_INDEX='StatusIndex'
DIAG_START='2026-10-06T10:00:00Z'
DIAG_END='2026-10-06T10:30:00Z'

aws cloudwatch get-metric-statistics \
  --profile "$DIAG_PROFILE" --region "$DIAG_REGION" \
  --namespace AWS/DynamoDB \
  --metric-name WriteKeyRangeThroughputThrottleEvents \
  --dimensions Name=TableName,Value="$DIAG_TABLE" \
    Name=GlobalSecondaryIndexName,Value="$DIAG_INDEX" \
  --start-time "$DIAG_START" --end-time "$DIAG_END" \
  --period 60 --statistics Sum --output json --no-cli-pager
Repeat the query for ConsumedWriteCapacityUnits with the same dimensions and Sum. Record units, period and statistic. A one-minute consumed sum divided by 60 is an average rate, not the peak second. Keep application latency separately: service-side success latency does not include all client queuing and retries. The DynamoDB metric reference defines the metrics.
Sort returned datapoints by timestamp when displaying them. CloudWatch does not guarantee chronological response order. For this example's recent 30-minute window, 60-second periods are appropriate; older windows require coarser retained resolution. An empty result requires checking identity, dimensions, time range and publication, not writing zero into the packet. GetMetricStatistics documents these constraints.
Output and gate: timestamp-aligned exported series with exact query inputs. Do not count throttle events as unique failed business operations. Report service attempts and application outcomes as different measures.
7. Investigate key distribution without scanning production
For a key-range reason, the application owner supplies sanitized distribution evidence from existing instrumentation or an approved sample. Describe which key the affected resource uses. A well-distributed table key does not prove a well-distributed GSI key. Do not run a full-table scan to manufacture a traffic histogram: stored item distribution and incident-time access distribution are different things.
Existing Contributor Insights reports can help. If it was not collecting during the incident, record that gap. Optional enabling is a separate monitoring change, not a read-only diagnostic step. The operator and security reviewer choose the specific table or GSI, mode, duration, readers and retention before approval. AWS offers throttled-keys and accessed-and-throttled-keys modes with different event processing and billing. See how Contributor Insights works and its pricing notice. Treat exposed key values as potentially sensitive.
For the GSI write-back-pressure investigation, the Most Throttled Items graph has a material blind spot: AWS says it does not measure write throttling caused by insufficient GSI write capacity. AWS recommends the affected GSI's Most Accessed Items graph to investigate imbalance; that graph requires accessed-and-throttled-keys mode. An empty throttled-keys report cannot establish complete coverage or rule out this cause. Retain the reason-specific resource metrics and application evidence regardless of report contents.
Existing-report readers need cloudwatch:GetInsightRuleReport; resource-status checks use dynamodb:DescribeContributorInsights. Optional enabling or disabling requires a separate dynamodb:UpdateContributorInsights change role. First-time setup can require service-linked-role creation permission, and AWS documents decrypt permission for KMS-encrypted tables when updating Contributor Insights. The security reviewer checks the exact key policy and role conditions rather than copying wildcard examples. See Contributor Insights IAM guidance.
A missing dominant key is not an acquittal. Rolling hot ranges and scan-driven patterns can require application access analysis. AWS's key-range troubleshooting guide discusses those cases. Do not promise immediate partition adaptation or claim a capacity-mode switch repairs a concentrated key.
Output and gate: distribution hypothesis, sample method, coverage limits and privacy owner. If distribution is unknown, keep the diagnosis at “resource and limit identified,” not “root cause proven.”
8. Work one illustrative GSI case
Suppose an order writer targets Orders and captures IndexWriteKeyRangeThroughputExceeded for Orders/index/StatusIndex. The table key is an order identifier; the index partition key is status. In a synthetic fixture of 100 attempted writes, 80 use the index key pending. This is deliberately invented teaching data, not an Ampity customer result or a benchmark.
The application engineer computes 80/100 = 80% concentration in that fixture. This supports a test hypothesis about pending; it does not establish a physical partition map or a throughput threshold. The operator checks the GSI's write key-range event series for the incident. The application engineer compares its timing with retry attempts, deadline failures and the real approved distribution sample.
Reject the shortcut “the table is under capacity, so DynamoDB is healthy.” Also reject “80% means we must shard now.” A candidate test might reduce the synthetic concentration while preserving total offered work and item shape. A future sharded status key changes query fan-out, pagination and reconciliation, so it belongs in a separate data-model migration decision.
Output and gate: a falsifiable statement: “Writes mapped to the status index concentrate during the affected window; reduced concentration should lower that index's key-range throttle events under equivalent offered work.” If the resource metrics or real distribution disagree, revise the hypothesis. Do not retrofit the synthetic example into incident evidence.
9. Select one bounded experiment or mitigation request
The incident lead chooses a reversible application-level containment option first when immediate protection is needed, using the team's approved incident runbook. Examples include limiting a noncritical producer or pausing a bounded import, provided deadlines, queue age and downstream effects remain acceptable. This article does not grant authority to pause customer work.
| Identified limit | Proposed next investigation/change request | Evidence before acceptance |
|---|---|---|
| Partition/key range | Controlled distribution or request-shape experiment | Same offered work, protected query behavior and measured resource events |
| Provisioned resource | Review the affected resource's setting and scaling timeline | Capacity, cost and application completion comparison |
| Account quota | Verify the applicable regional quota and approved quota request | Exact limiting resource, quota evidence and request status |
| Configured maximum | Review why the ceiling exists before proposing a change | Written cost approval and preserved prior maximum |
A retry-policy change is not free capacity. The application owner checks total retry layers, deadlines and duplicate-safe write semantics. Use deployed SDK documentation for exact configuration. Do not replace bounded SDK retries with an unbounded loop.
For a sandbox experiment, record approved account, synthetic dataset, client version, item sizes, key shape, offered rate, duration and maximum spend. Stop at any resource mismatch, data exposure, protected-operation regression, retry amplification or exceeded budget. Do not copy production payloads. Output and gate: one owned change request with success criteria and stop conditions agreed before execution. This draft has not executed such an experiment.
10. Record reversal and cleanup before changing anything
The change owner preserves the previous setting or application configuration and names the operator who can restore it. Reducing producer concurrency is reversible only if the resulting backlog can still meet its obligations. A restored capacity ceiling can reintroduce throttling. Read the current load before reversal rather than blindly restoring an old number.
No traffic reversal undoes committed writes or external effects. Do not roll back by deleting a GSI, restoring an old table over current data or dropping failed business operations. Key redesign needs its own migration, compatibility and reconciliation plan.
If optional monitoring was enabled, the monitoring owner decides whether to retain or disable it through DynamoDB's supported controls, captures required reports first and verifies resulting state. Disabling Contributor Insights deletes its generated rules; do not directly delete those rules in CloudWatch. Preserve the report exports under the agreed evidence retention policy. Retire temporary sessions and sandbox resources through the approved change process, not a destructive command copied from this article.
Output and gate: reversal record, backlog disposition and monitoring/evidence cleanup readback. If a change cannot be safely reversed, document forward recovery and get explicit acceptance before execution.
11. Complete the evidence packet
Acceptance criteria for the diagnostic handoff
The incident lead and resource owner record PASS, FAIL or HOLD, capture time and evidence reference for every criterion. These criteria accept an investigation, not an unexecuted mitigation.
- The failed request or batch outcome is linked to its actual table/index ARN, Region, operation and all returned throttling reasons. Unprocessed batch work has an owned disposition.
- Resource configuration and matching metric dimensions were captured for the relevant interval. Offered load, client retries and timestamp uncertainty are recorded before comparing rates.
- The proposed limiting mechanism follows the returned reason and resource. A missing Contributor Insights signal, including the GSI write-capacity blind spot, is not evidence that no hot key exists.
- The next decision states what is supported, what remains unknown and which single bounded experiment or escalation could resolve it. An unavailable required observation yields HOLD, not an invented result.
- Any separately authorized change has pre-agreed stop, reversal or forward-recovery conditions, backlog disposition and evidence retention. Improvement requires an observed representative comparison, not merely a proposed setting.
The handoff can accept a bounded unresolved escalation if its owner and missing evidence are explicit. It cannot claim throttling was fixed without the corresponding post-change observations.
Use this fillable record. Keep raw confidential evidence in its controlled system; link sanitized exports rather than pasting customer keys into a broadly shared ticket.
Incident ID / lead / business operation:
Expected account / principal / Region / evidence classification:
UTC incident window / observation window / configuration timeline:
Application offered / completed / deadline-failed work:
API / exception / request ID / retry configuration:
Every reason + exact resource ARN:
Table and index keys / capacity mode / relevant prior settings:
Metric name / dimensions / statistic / period / query window:
Evidence links / empty-series explanation / missing fields:
Distribution sample method / coverage / privacy limitations:
Hypothesis / competing explanation / disconfirming test:
Proposed change / executor / approver / maximum cost:
Success criteria / stop condition / previous state:
Observed test results (or NOT EXECUTED):
Reversal limits / backlog reconciliation / cleanup readback:
Unresolved issue / escalation owner / next check time:
Reviewer / acceptance status / remaining limitations:
Done means the evidence supports a bounded decision, not necessarily that throttling disappeared. The incident lead can close the diagnostic task with an unresolved escalation if the limiting resource is identified but required evidence is unavailable. Do not label a proposed mitigation validated. After an authorized change, compare a representative window with the baseline and account for changed offered load before claiming improvement.
12. Questions that change the next action
Does spare table capacity rule out throttling? No. Investigate the resource named in the error, including a GSI and its partition distribution.
Should we immediately enable Contributor Insights? Only with monitoring, cost and key-data approval. Existing records can support the incident; newly enabled monitoring does not replace missing historical evidence.
Can increasing capacity be the right response? Yes, when the affected resource and limit support it and the cost owner accepts the change. A key-range diagnosis still requires distribution evidence and a protected-operation test.
What should the team do next? Complete one resource row in the evidence packet before requesting a change. If the result points to a wider scaling decision, hand the packet to the database owner rather than starting with a generic architecture redesign.
This is an unexecuted educational procedure, not an incident result or a workload-specific technical sign-off. Vendor behavior was rechecked against the linked primary documentation on 8 October 2026. Verify the deployed SDK, permissions and current resource settings before executing the procedure.
Related resources
Database Scaling Strategies
Diagnose database limits, compare scaling options, budget connections, and roll out changes with workload evidence, consistency checks, and recovery gates.
Database Scaling Patterns: A Measured Path from Queries to Shards
Choose database scaling changes from workload evidence, consistency requirements and recovery limits. Includes a query-plan decision record and a shard-skew example.